2008
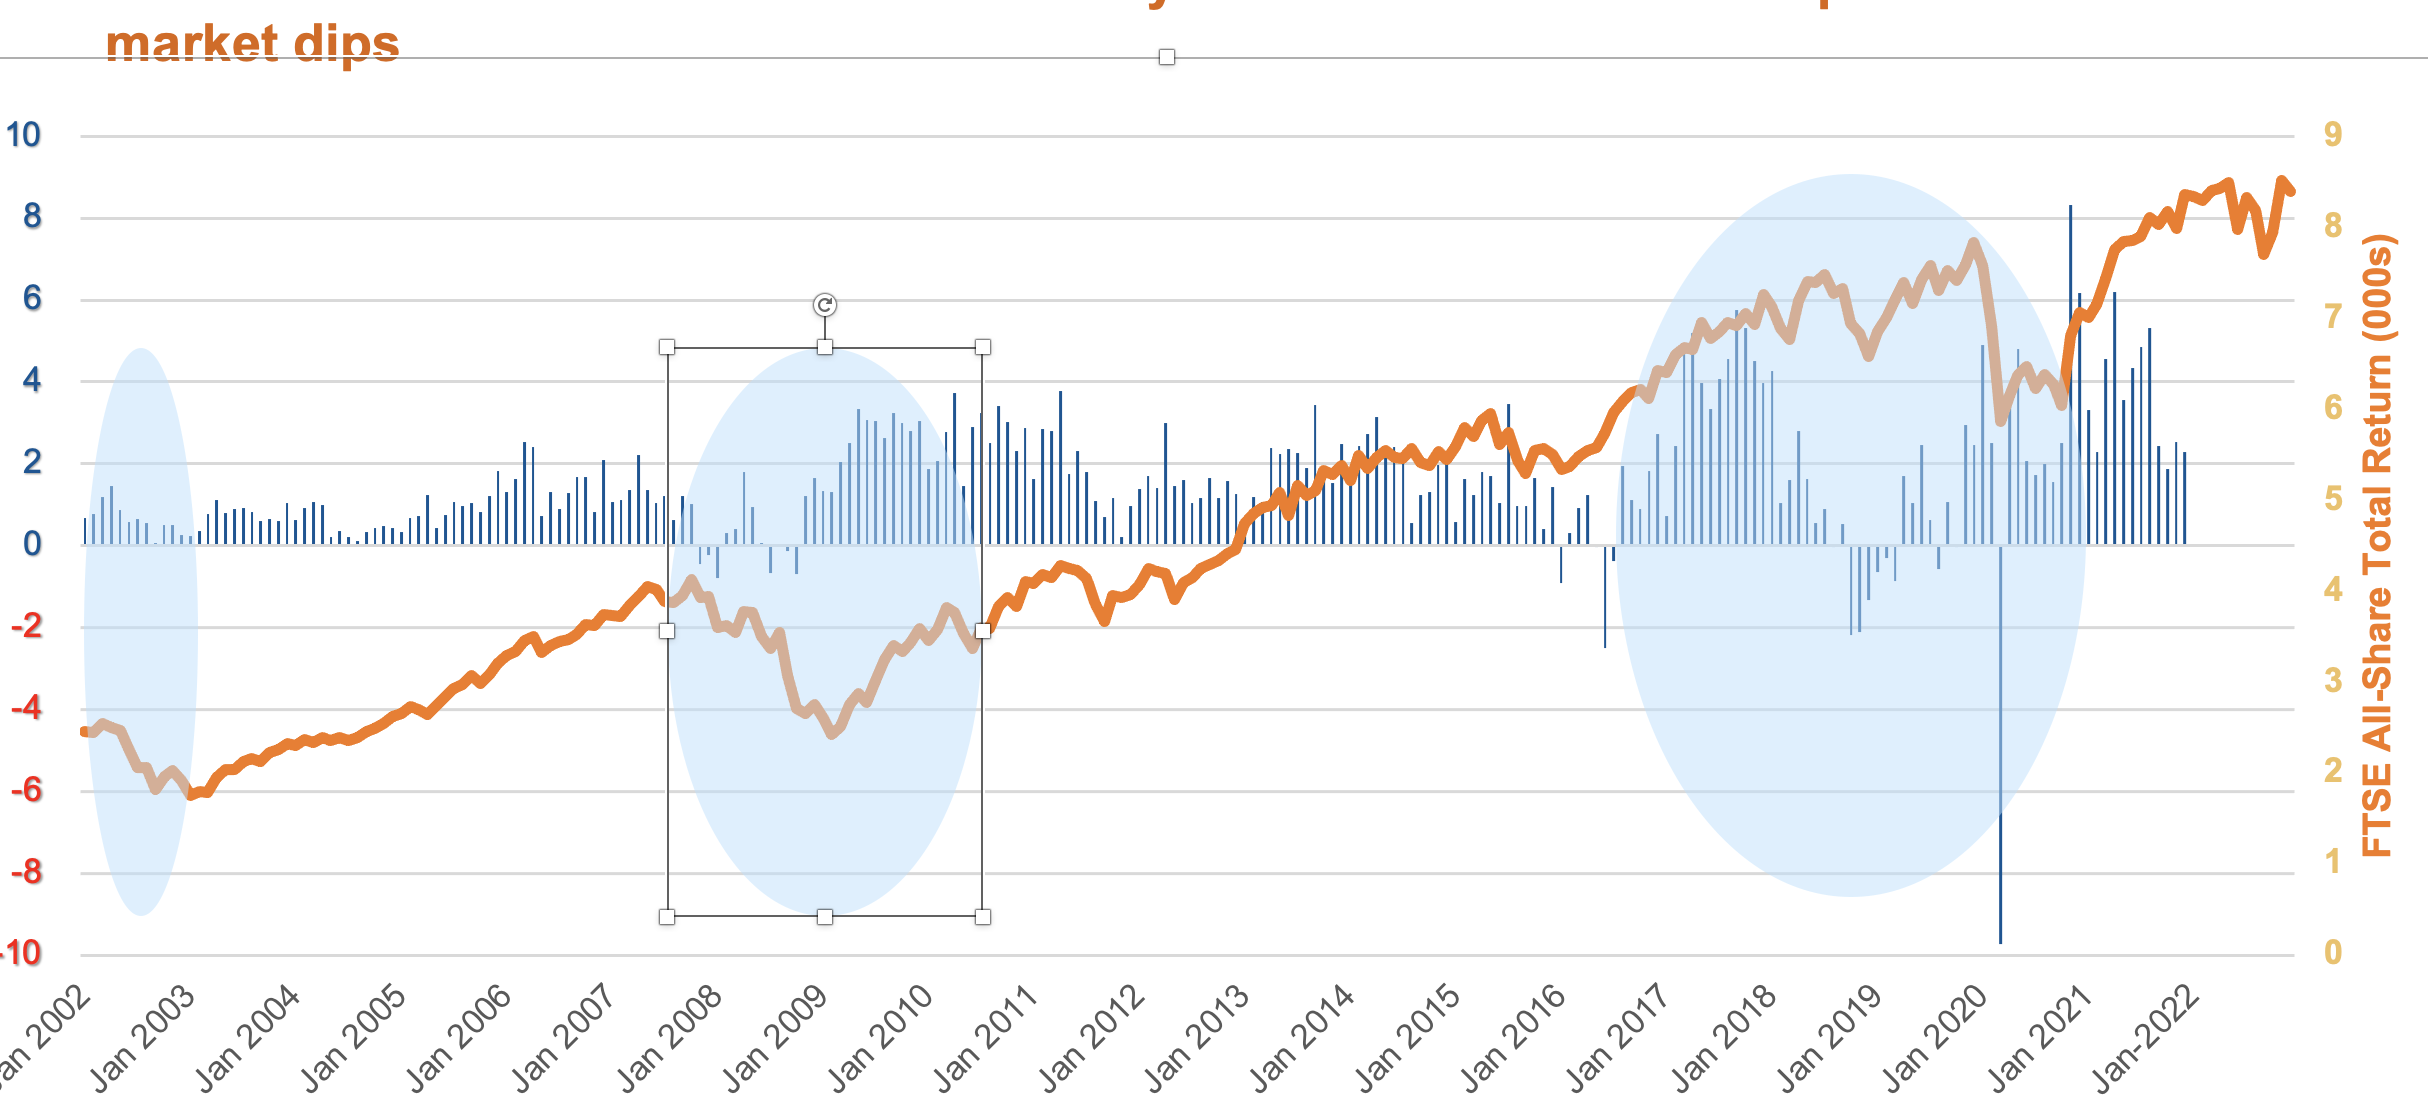
In the global financial crisis of 2007-2008, the stock market dipped 33%. During the same period investors redeemed over £1.5bn worth of holdings.
2018
Amid political wranglings and fears that a hard Brexit would cause major economic distruption, the market dipped by 12.1% in the second half of 2018 and retail funds saw net redemptions of £5.1 billion.
2020
As a final example, the market dipped by 25% in the first quarter of 2020 because of the COVID-19 global pandemic. Investors reacted by posting a chart-skewing net redemption of £9.7 billion in one single month - March 2020.

Next

Next

Next

Next
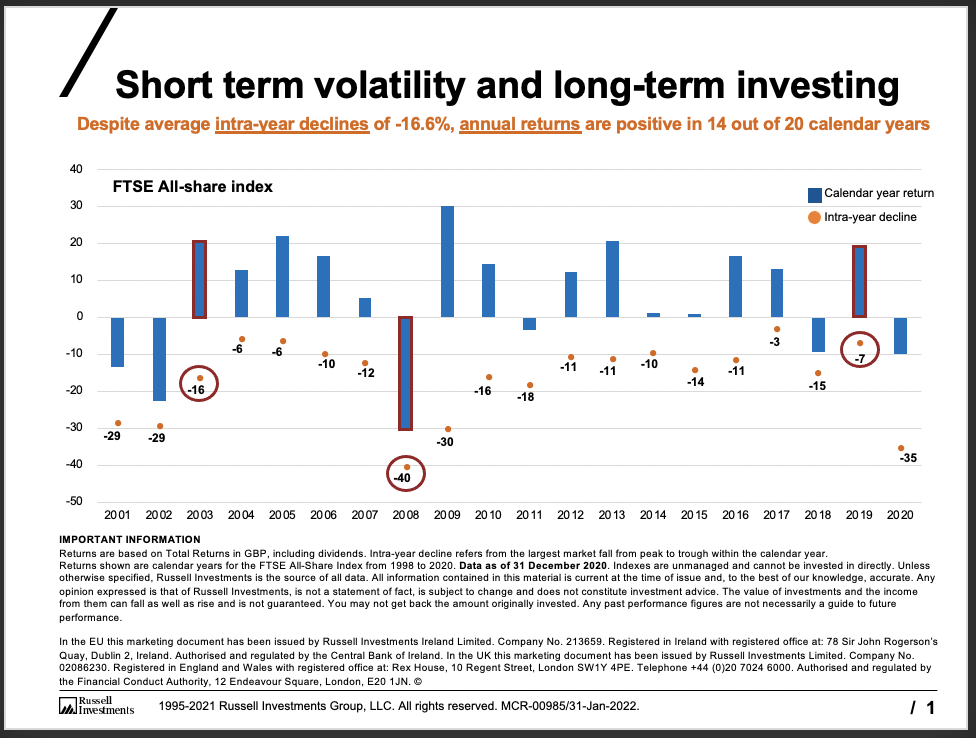
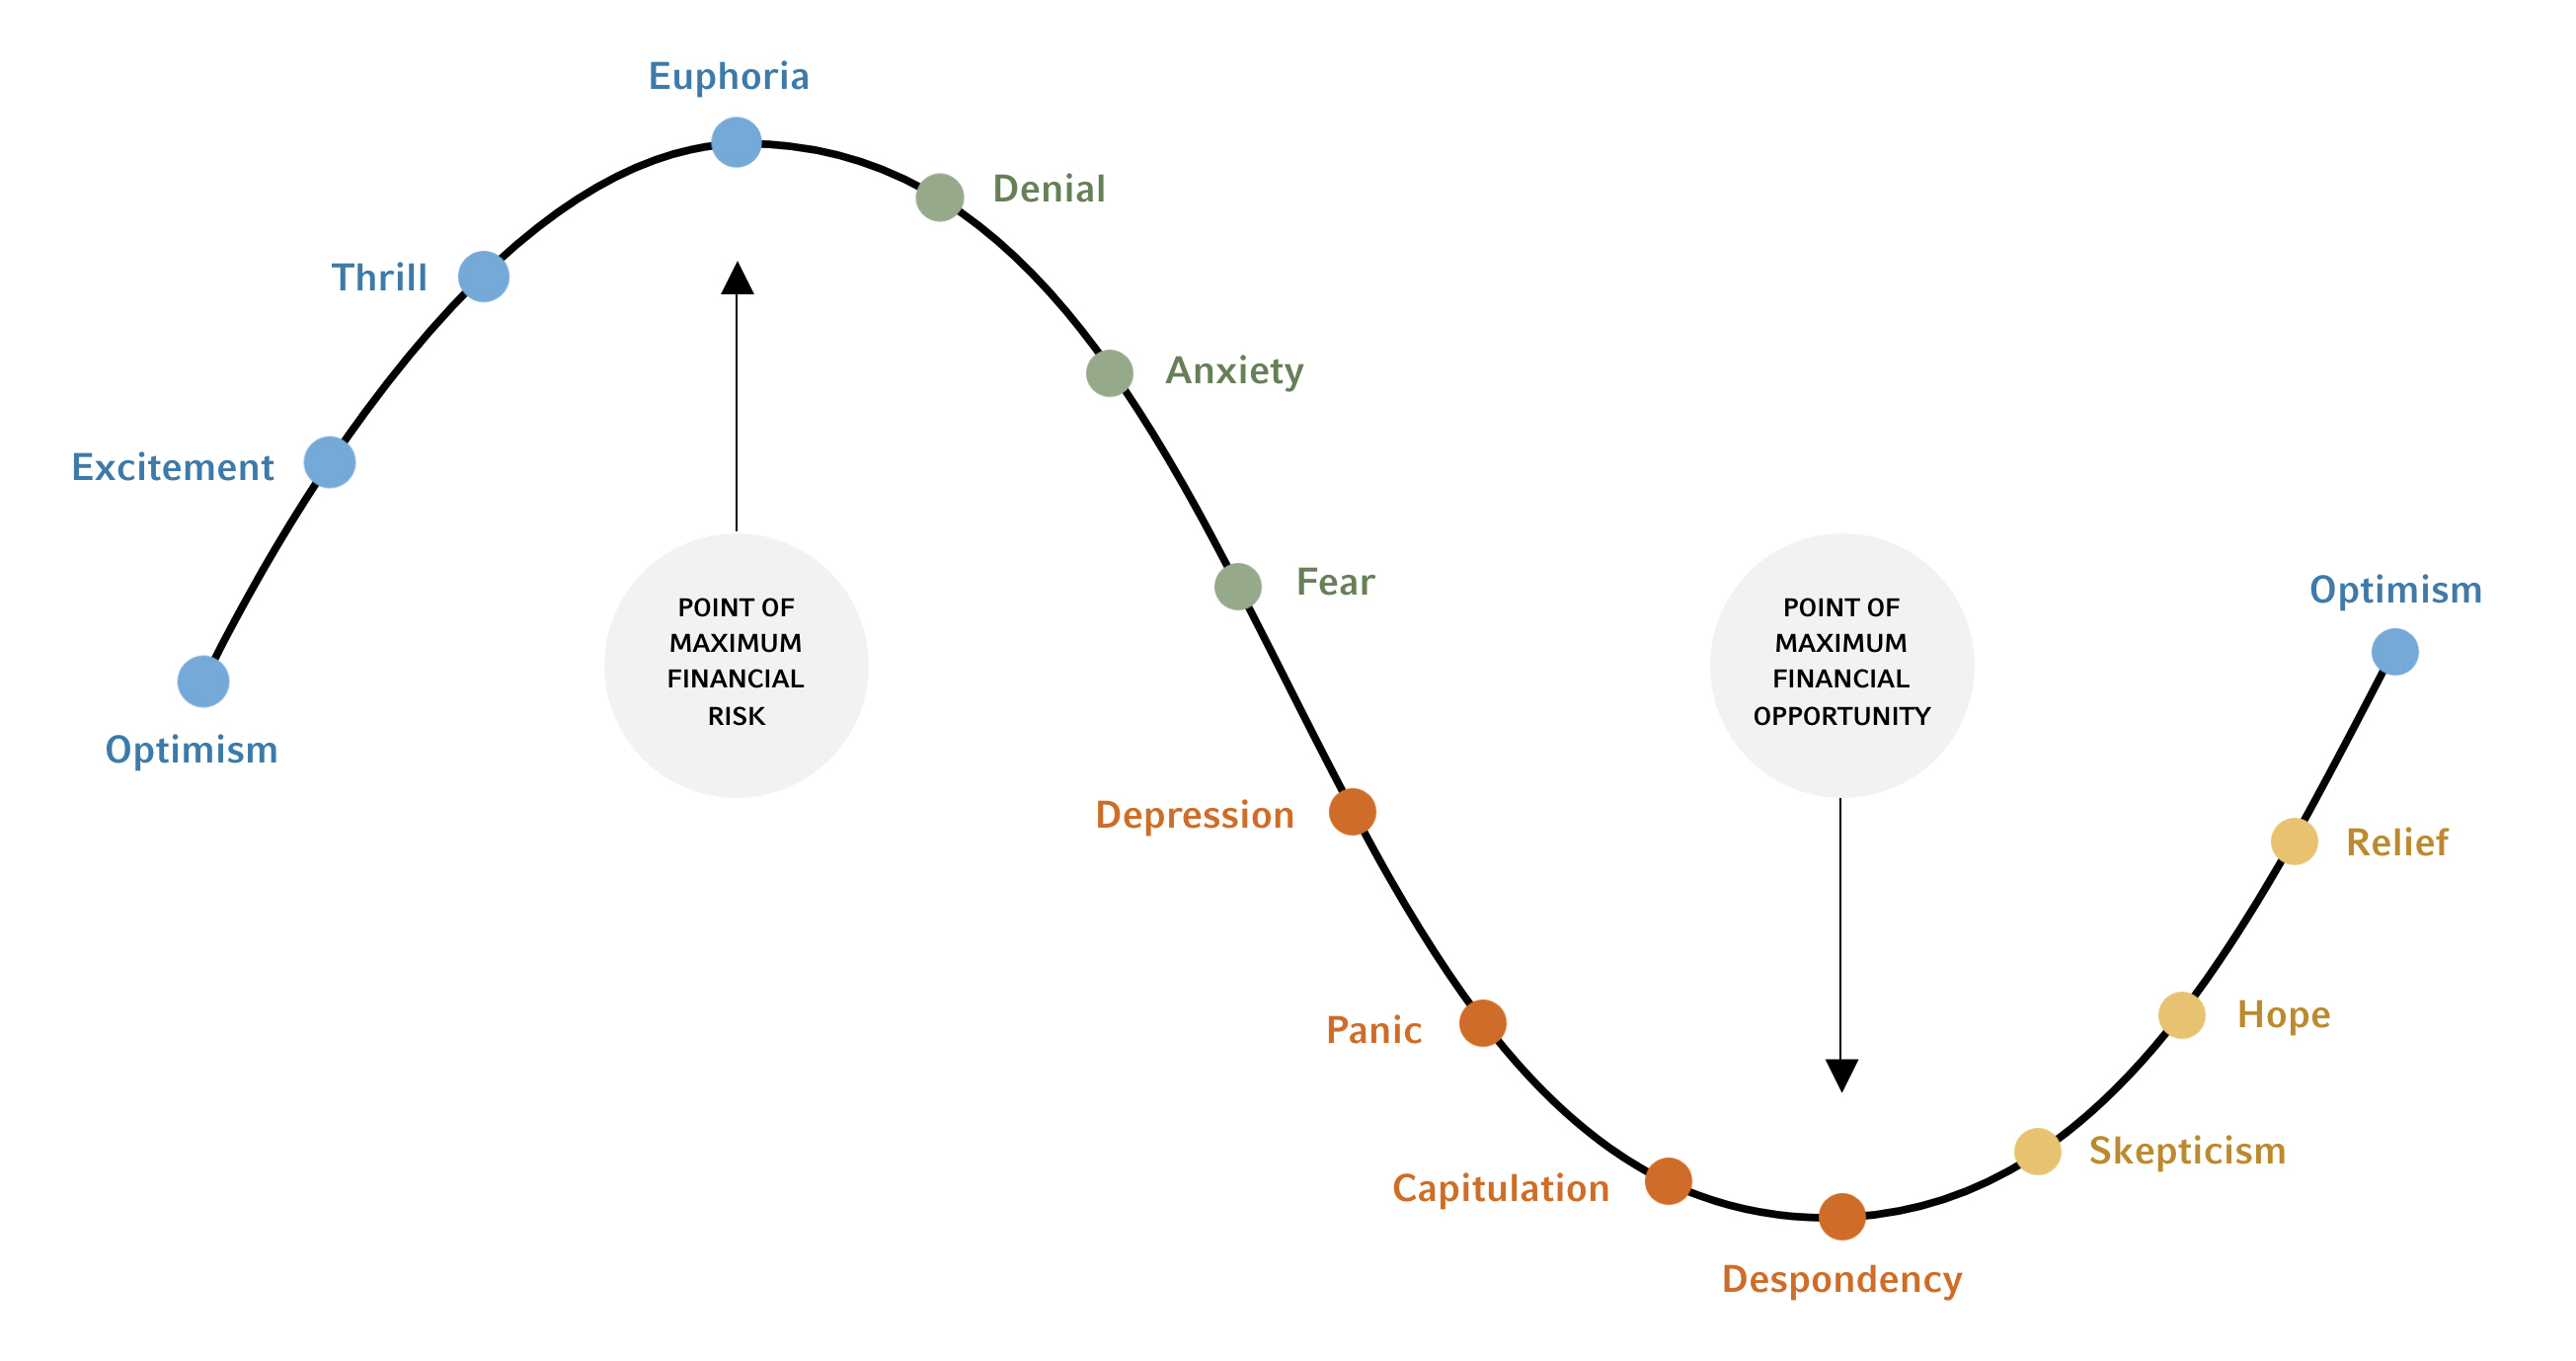
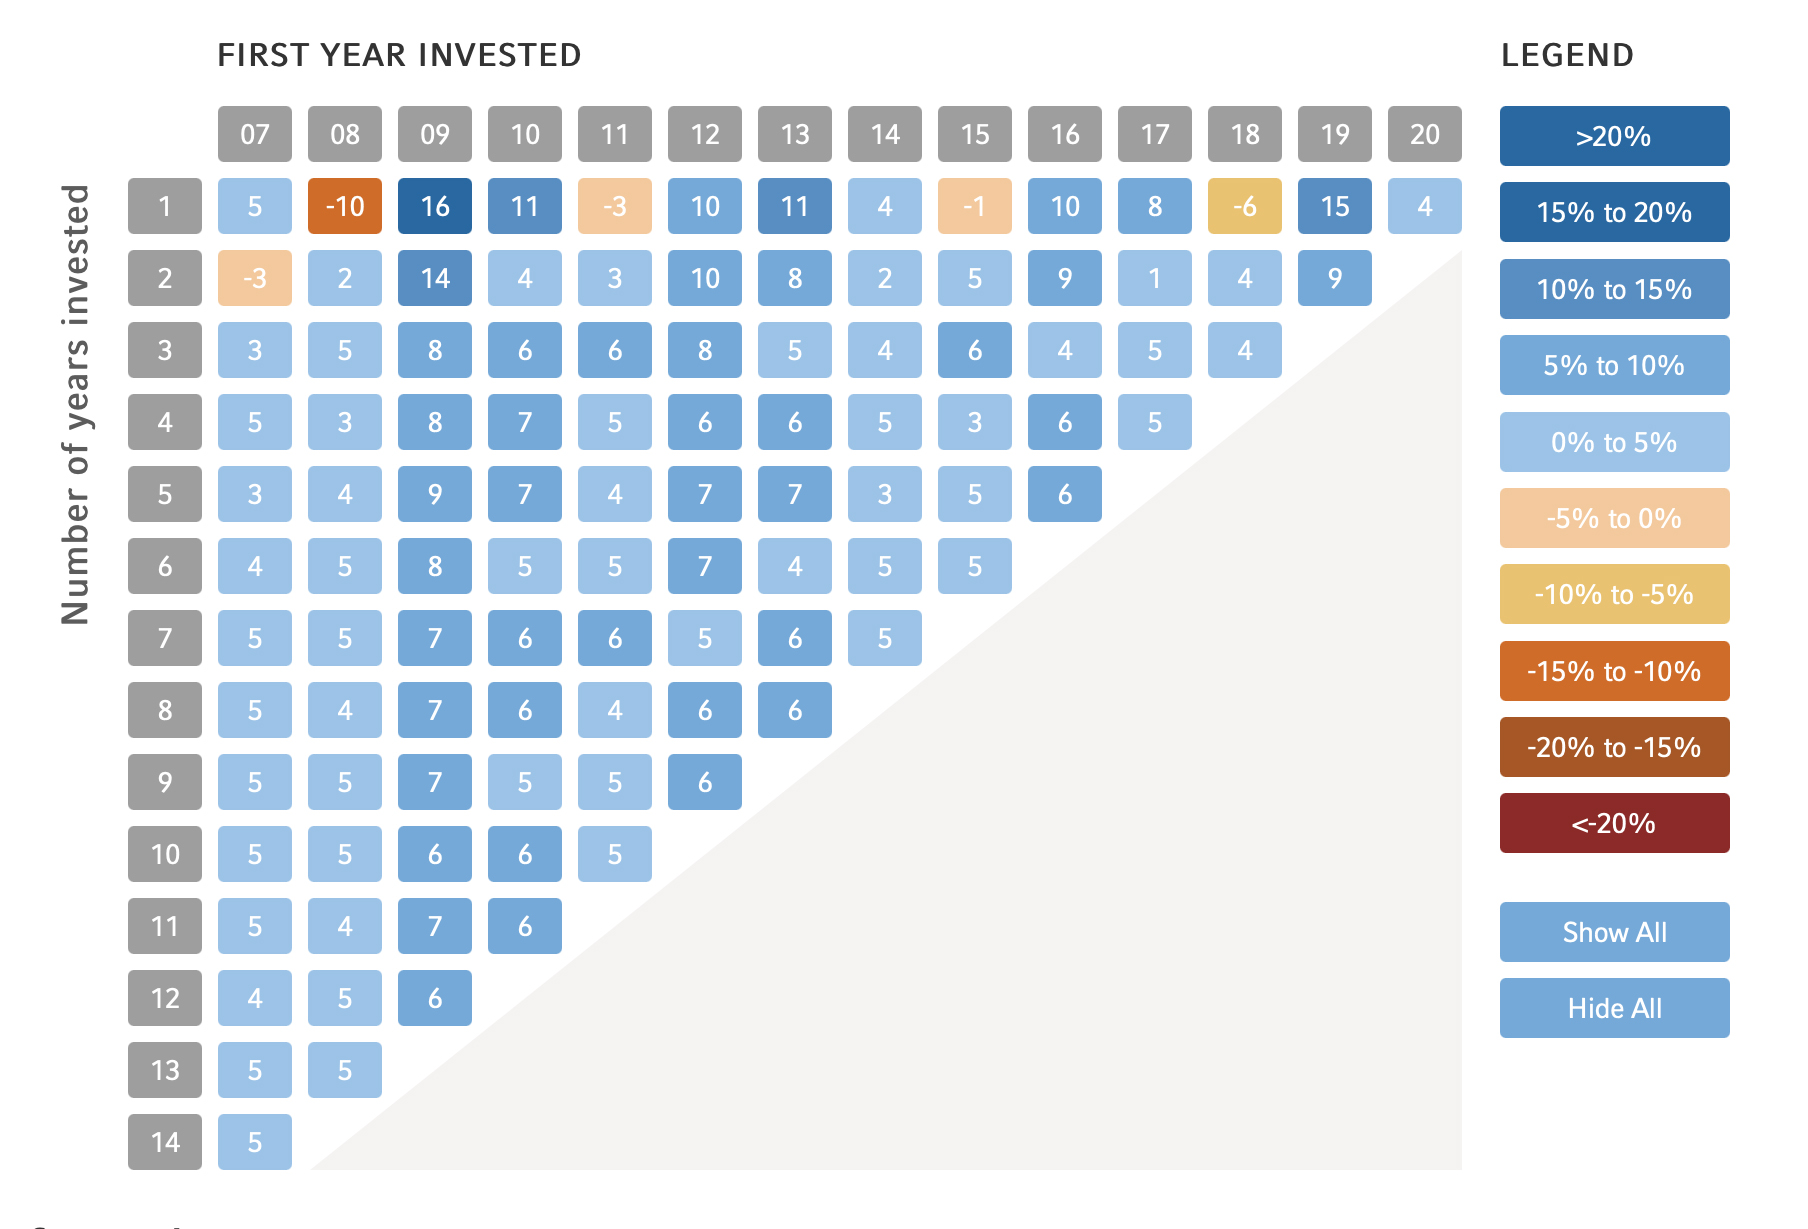
Use these two resources to continue communicating the value of staying invested and the impact of making poorly-timed investment decision based on the cycle of investor emotions.

Back

Back

Back

Back

Back
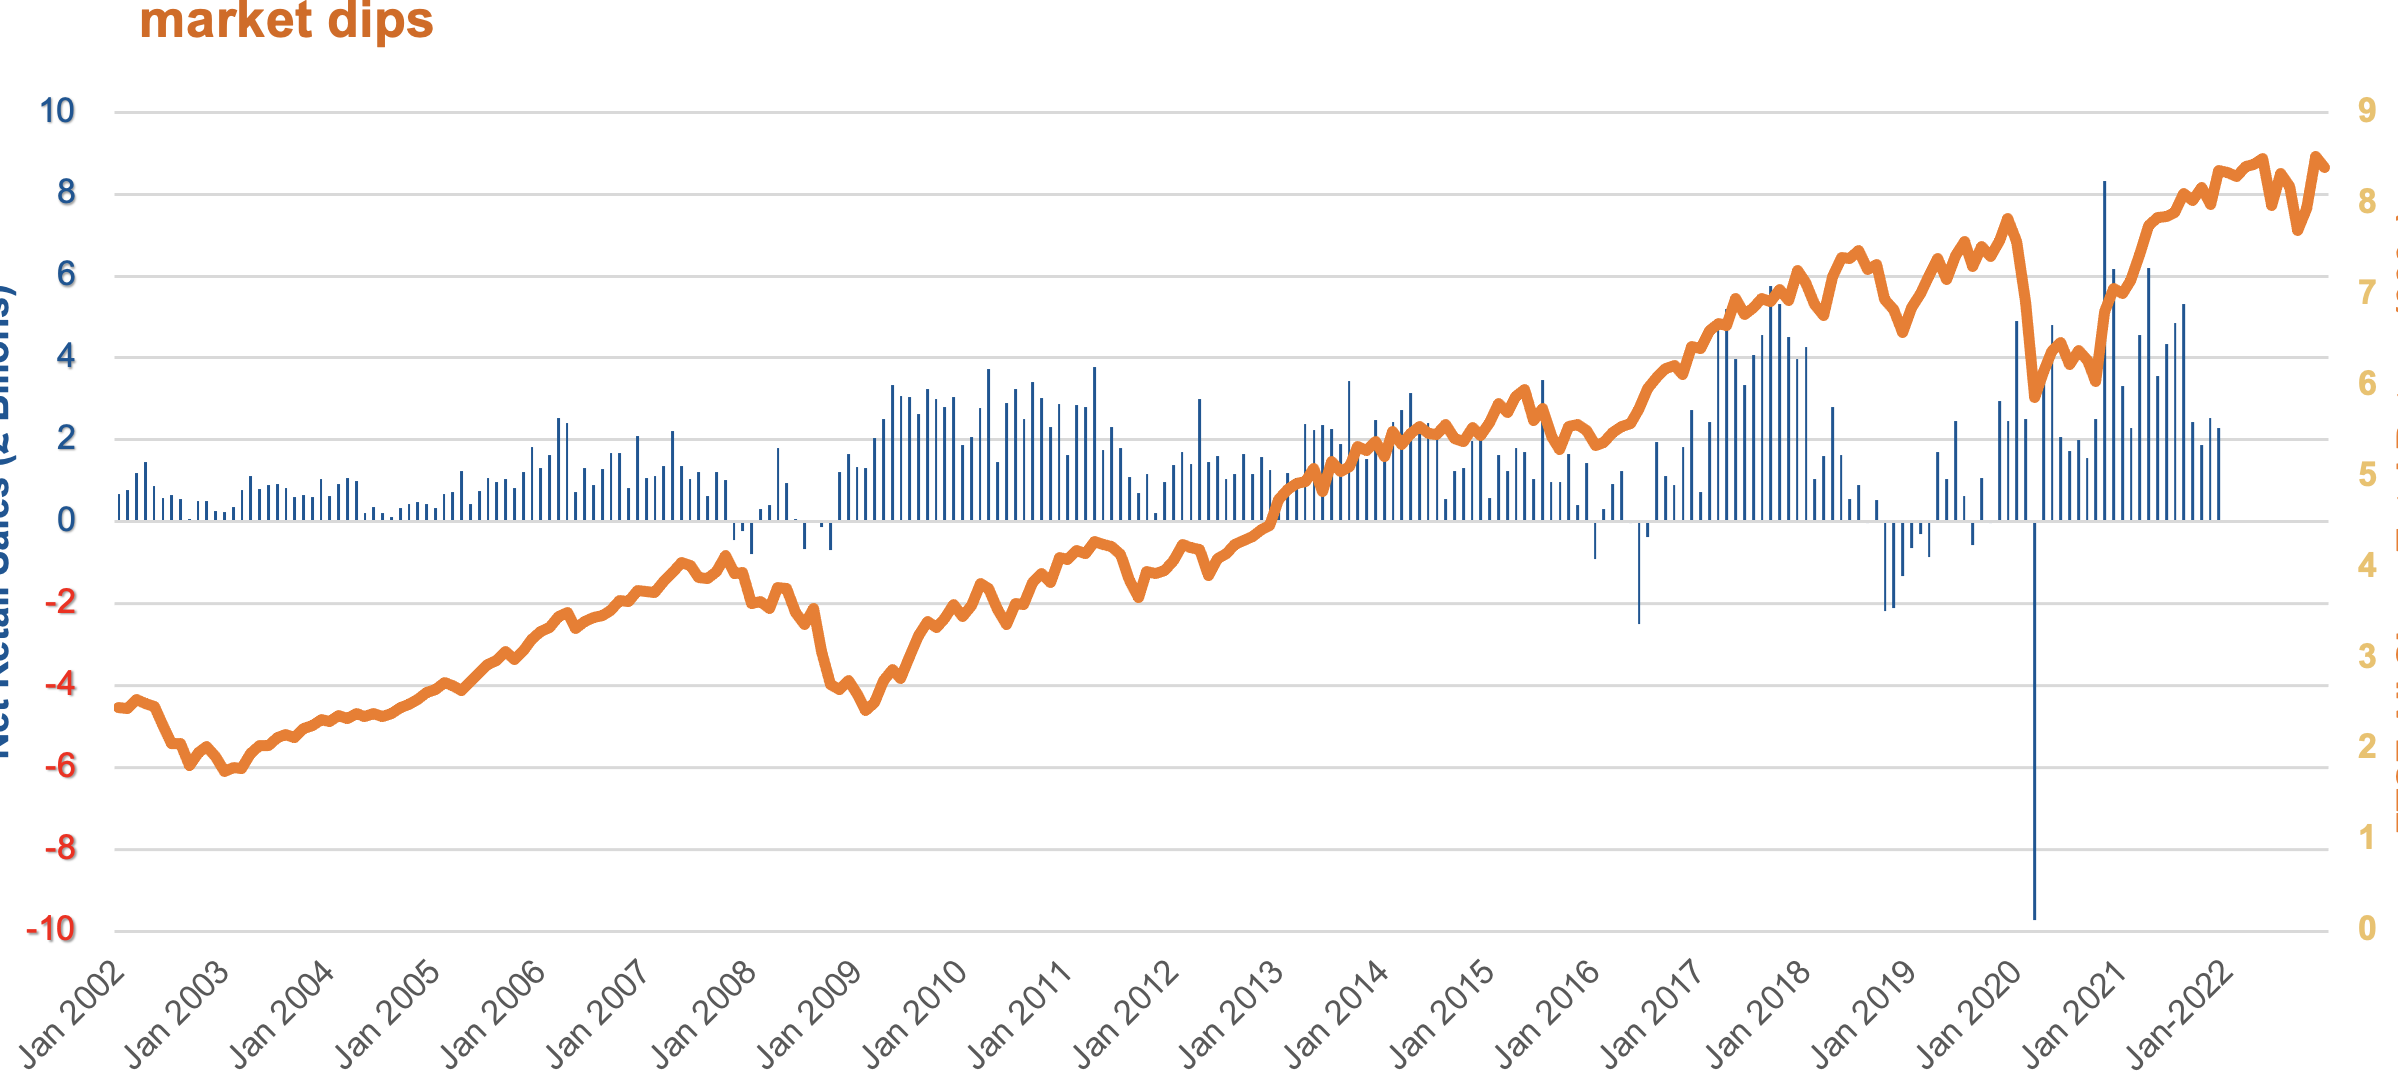
The blue bars are monthly net sales (or redemptions) in and out of retail mutual funds over the last two decades, measured in billion of pounds on the left axis.

Next

Next

Back

Back

Next
Important information
Issued by Russell Investments Ireland Limited. Company No. 213659. Registered in Ireland with registered office at: 78 Sir John Rogerson’s Quay, Dublin 2, Ireland. Authorised and regulated by the Central Bank of Ireland. In the UK this marketing document has been issued by Russell Investments Limited. Company No.02086230. Registered in England and Wales with registered office at: Rex House, 10 Regent Street, London SW1Y 4PE. Telephone +44 (0)20 7024 6000. Authorised and regulated by the Financial Conduct Authority, 12 Endeavour Square, London, E20 1JN. © 1995-2023 Russell Investments Group, LLC. All rights reserved. MCR-01240/31-Jan-2024
Source: The Investment Association for Net Retail Sales, Yahoo! Finance for FTSE All Share values. Data as at 31 December 2022. For illustrative purposes only. Indexes are unmanaged and cannot be invested in directly.

This chart shows how retail investors often buy when the market is at its peak and sell when the market dips.
Avoid buying high and selling low
FTSE All Share Total Return (000s)
Net retail sales (£ billion)
-10
-8
-6
-4
-2
2
4
6
8
10
0
2002
2003
2004
2005
2006
2007
2008
2009
2010
2011
2012
2013
2014
2015
2016
2017
2018
2019
2020
2022
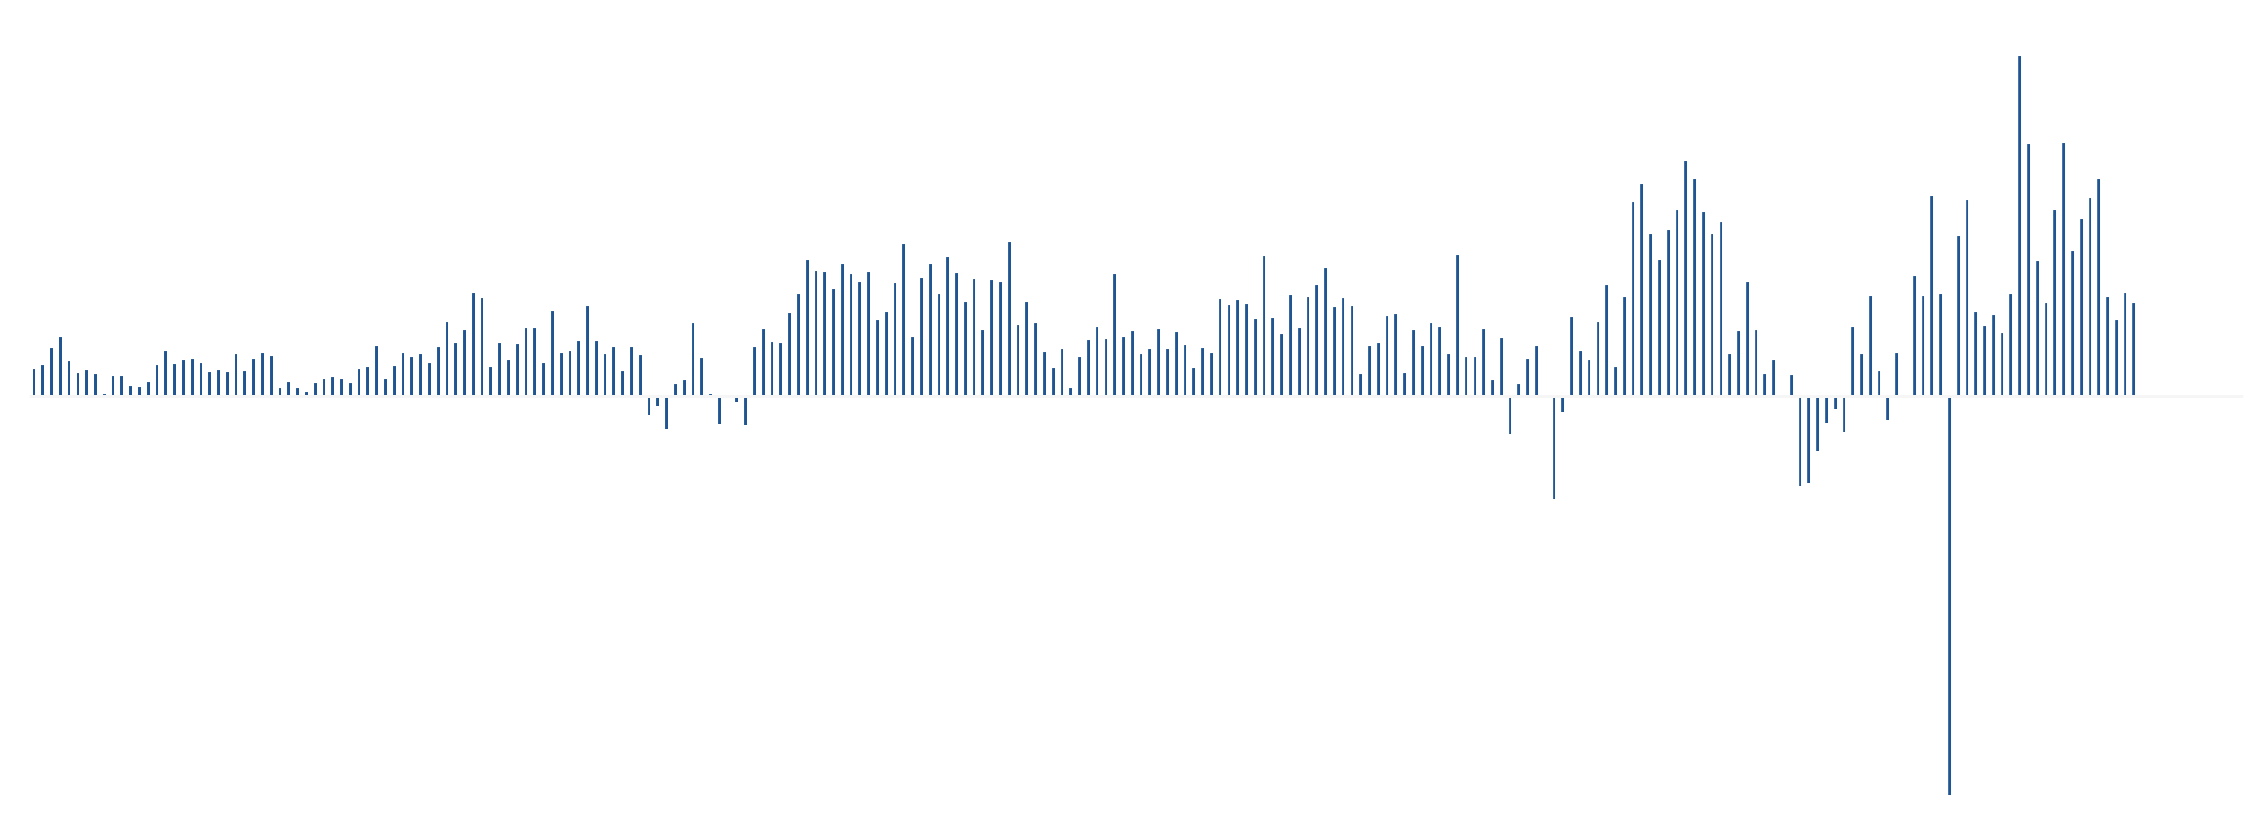

The orange line represents the FTSE all-share return over the same time period, measured on the right axis.
When overlaid on top of one another, you see how these two data sets are related. This is especially obvious in periods of volatility - highlighted in the blue rectangles - when stock market lows prompts investors to sell.

Next

Back
In each of these examples investors sold at the lowest points, locking in their losses and missing out on the subsequent market upswings.

See value of staying invested

Cycle of investor emotions
2021
1
2
3
4
5
7
8
9
6


